Three vital investment metrics your broker doesn’t always tell you
Experts
Experts
Sharesight is a leading aggregation platform in the Australian market that provides investors with a one-stop shop to manage their investments across different asset classes, exchanges and jurisdictions.
Through its simple online platform, Sharesight enables investors to save time and money, track their dividends, assess the true performance of their portfolio and quickly compile trading data for tax purposes.
The platform provides up-to-date information, tracking more than 40 of the world’s major stock exchanges and more than 240,000 stocks, ETFs and funds to give investors an effective ‘single picture’ of their investment performance.
In this article, the company highlights three important financial details your broker’s performance numbers don’t tell you.
As an investor, knowing the true performance of your investment portfolio is crucial. Performance metrics provided by brokers are typically reduced to daily price movements and capital gains measured from the stock’s purchase date.
At Sharesight our platform includes various key metrics vital to providing investors the full picture of their investment portfolio’s performance. Here are three metrics we believe are crucial but often missing in your broker’s numbers.
Brokers often focus on daily price movements and capital gains (since the purchase date). However, an annualised return lets you know how your investments are performing over the long term, which is important when monitoring an entire portfolio.
Let’s look at the performance data provided by a standard broker in the middle of 2021 for a basket of stocks bought in 2019.
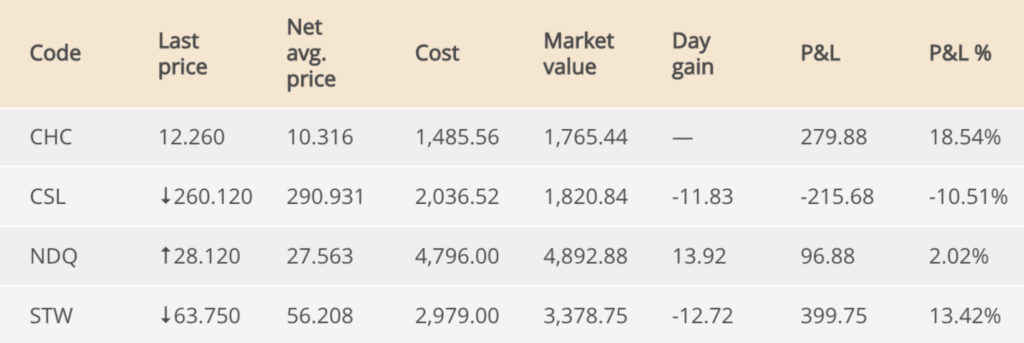
Notice emphasis is on daily price changes, which may be useful if trading on daily price variations. However, for calculating your investment performance over the long term there is not much point to daily price changes.
Often brokers will report on capital gains or losses to date under the P&L heading. While good to know, this figure is not useful for comparing performance of various investments.
Examining Charter Hall (ASX:CHC) above, the capital gain is 18.54% since the stock’s purchase in 2019. However, over the 12 months to March 2021 when this snapshot was taken, CHC had achieved a capital gain of 30.4%. Using the Sharesight platform an investor can determine if this strong return would have been achieved with other investments.
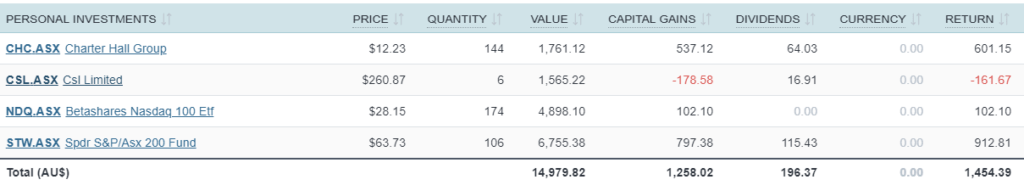
At Sharesight, returns are calculated by default on an annualised basis, enabling an investor to directly compare the performance of an investment to other holdings in their portfolio over the same period or even hypothetical investments they could have made instead.
Dividend return can have a significant impact on your investment performance and is therefore an important metric to track. Dividend responsibility falls mostly on share registries or stock transfer agents and not brokers – so many brokers do not report this figure.
To track how much is being earned inclusive of dividends, investors must source this information from paper statements or share registry websites.
At Sharesight, we understand the importance of tracking dividend income. Our platform automatically tracks dividends, including an option to track dividend reinvestment plans (DRPs). Our Future Income Report enables investors to also view upcoming dividends that have been announced.
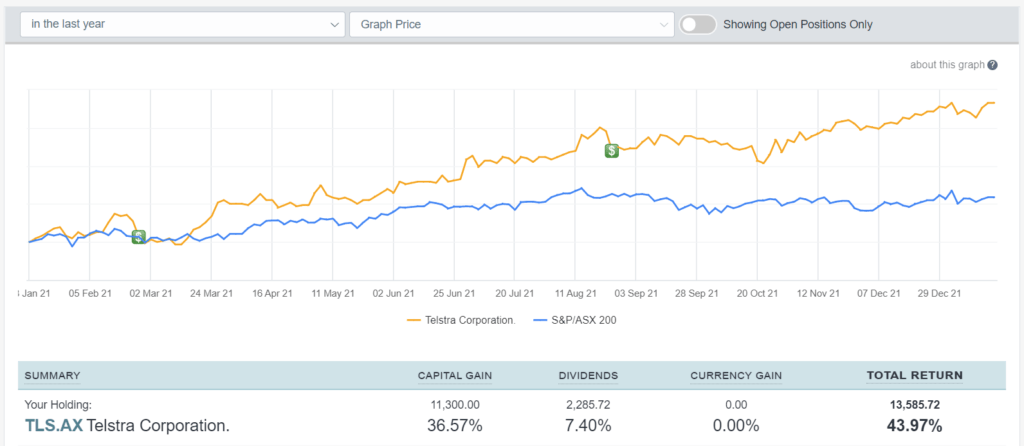
In the table below we can see Telstra, an ASX stock with significant dividend yield which contributes 7.40% of the total return over the last 12 months, resulting in a net total return of 43.97%.
Trading small and mid-cap stocks on international markets globally is more complex, and knowing the impact of foreign currency fluctuations on returns is vital for investors.
For example, back in February 2021 the Australian dollar was buying ~US80c but now (at the time of writing) it’s ~73 cents. If the AUD falls from the level it was when you bought a US investment, that adds a currency gain to your overall returns.
Conversely, if it strengthens in the wake of your transaction that will contribute to a currency loss.
The table below shows a Nasdaq stock holding in Apple. Foreign currency changes during the last 12 months contributed 6.73% to the total return, combined with a 33.68% capital gain and 0.68% dividend yield. The result is a net total return of 41.09%.

At Sharesight, investors can easily monitor currency fluctuations. Investors can track the performance of their investments in over 75 different currencies, including cryptocurrencies with access to live (20 minute delayed) and end-of-day pricing updates.
Remember, having a broader picture of the metrics around your investments will make for better decisions and returns in the longer term.
To discover the true performance of your investments, including what your broker isn’t telling you, sign up for Sharesight.


Get the latest Stockhead news delivered free to your inbox.