Guy on Rocks is a Stockhead series looking at the significant happenings of the resources market each week. Former geologist and experienced stockbroker Guy Le Page, director, and responsible executive at Perth-based financial services provider RM Corporate Finance, shares his high conviction views on the market and his “hot stocks to watch”.
Market Ructions: Doomsday Preppers, it’s time to rise and shine
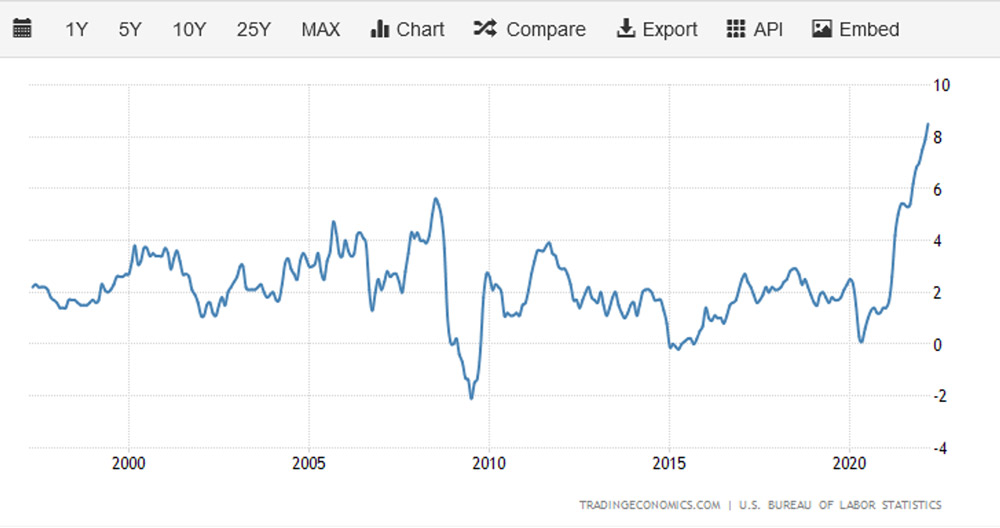
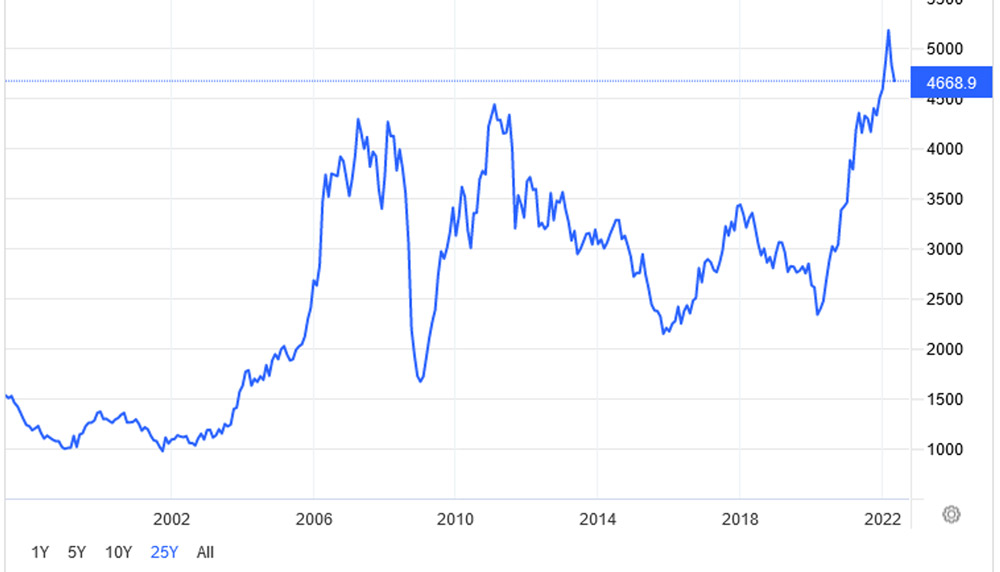
The end of another wild week with 1,000 point swings in the DOW Jones Index and a realisation that inflation (figure 1) is not “transitory” after all resulting in a 0.5% interest rate hike by the Federal Reserve last week.
The market is pricing in cash rates of 3.0% within the next 12 months.
Surprisingly, quantitative tapering (in laymans terms “taking your foot off the gas pedal”) appears to have been postponed, opening the door for further money printing?
FIGURE 1: US inflation 1997 to 2022 (source: www.tradingeconomics.com).
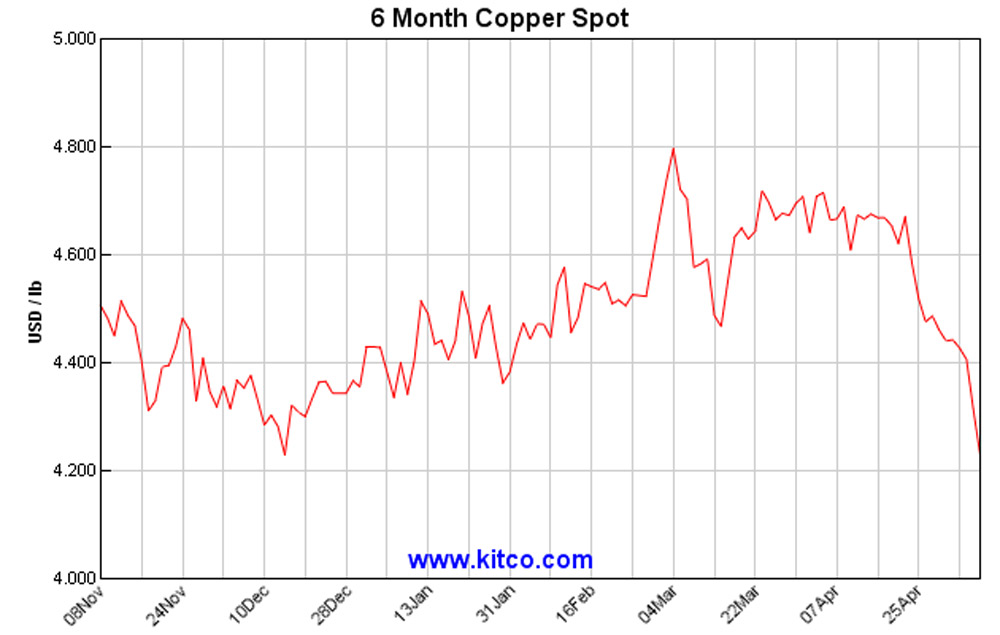
Base metals took a hit across the board with copper closing at US$4.23/lb, off 4.7% for the week representing a low for CY 2022. Having said that, the futures remain in contango, so this may represent a cyclical bottom for the red metal.
The market volatility reminds me very much of 2008, so anything could happen from here.
Demand for precious, base metals and bulks appears to be softening in response to Chinese lockdowns, uncertainty around the Ukraine war and a -1.4% US GDP result for Q1. Another quarter of negative growth would see the US officially in a recession.
Economic data out this week includes CPI (consensus 8.1%) and the Producer Price Index. Both numbers are no doubt going to be carefully watched in this volatile market.
I like Christopher Joye’s recent AFR article The Big Short which points out that interest rate expectations in the last 12 months have gone from 1.5% to 3.0% with a similar thematic around US 10-year Treasury bonds.
He is also forecasting another 25-30% fall in the S&P 500 with the NASDAQ to fall further. As for the Aussie home market, that could come off 15-20%. He has also added Terry McCrann (AFR) and Gareth Aird (CBA) to the list of doomesday preppers who were calling this scenario a year ago. Surely they all got the good oil for this economic outcome from this Stockhead column last year?
Well I did point out that Jerome Powell and Michele Bowman were doing a good impersonation of Laurel and Hardy. Turns out I may be right!
Mike McGlone (Bloomberg Intelligence senior commodity strategist) pointed out in his May report that commodities are up 50% in the previous 10 years with these gains likely to moderate as we enter this tightening phase.
He noted that the last time gold bottomed in 2015 (figure 3) it coincided with the end of a period of interest rate rises. It appears we are on a similar trajectory now.
So where to from here? Gold should head towards the magical US$2,000 barrier.
FIGURE 3: S&P/ASX All Ordinaries Gold chart 2007-2022 (source: https://www.marketindex.com.au/asx/xgd).
While commodities are cyclical, not all cycles are the same so we may see base metals, rare earths and uranium in particular stay at more elevated levels due to the limited supply outlook and the changing use of metals; notwithstanding that, softening demand could see further near term downside pressures.
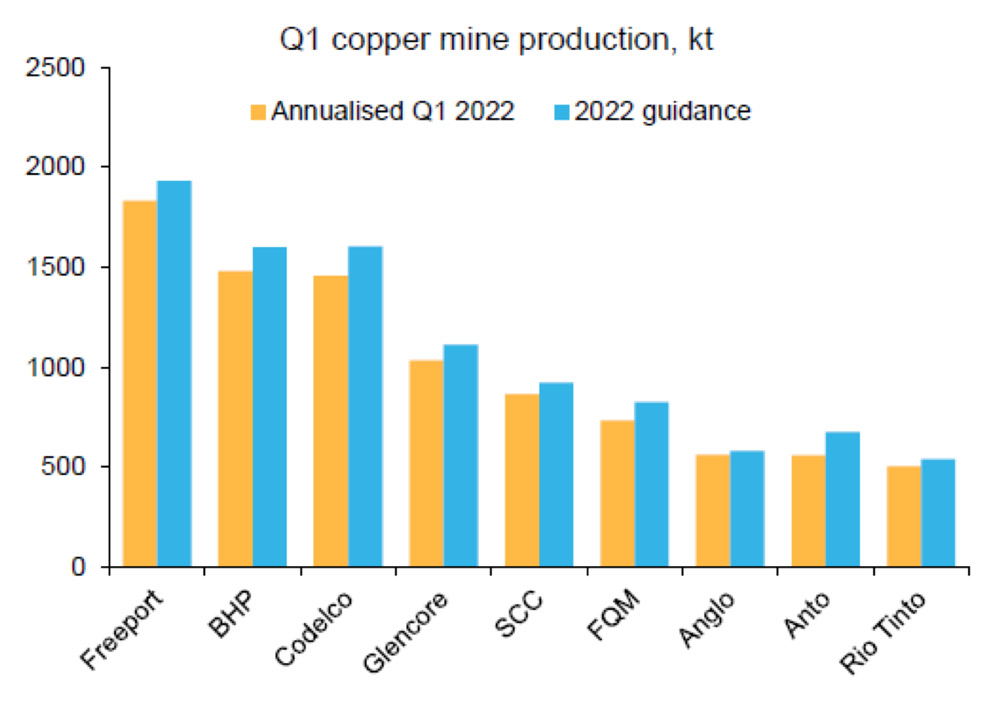
A brief look at copper guidance v actual production for Q1 2022 (figure 4) also shows a 6% shortfall in actual versus projected production. Supply disruptions are another moderating factor in our forward looking price forecasts which may result in a case for “stronger for longer”.
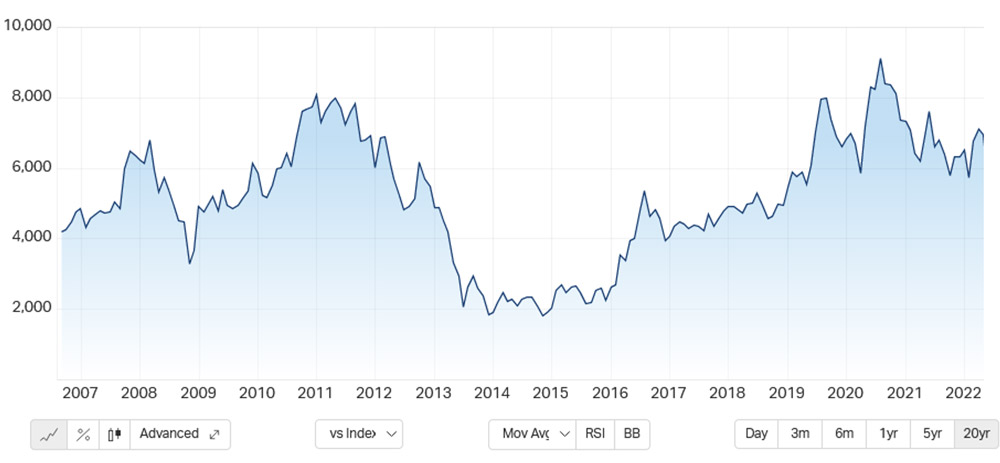
FIGURE 4: Q1 copper mine production, acutal v guidance (source: Macquarie, Sales Desk Macro Strategy, 2 May 2022).FIGURE 5: LME Metals index 1997-2022 (source: https://tradingeconomics.com/commodity/lme).
A glance at the LME Metals Index (a basket of aluminium: 42.8%, copper: 31.2%, zinc: 14.8%, lead: 8.2%, nickel: 2% and tin: 1%) would suggest we are at a cyclical high however there are a number of differences with the 2002 to 2012 upswing, most notably the change in the use of metals (particularly copper and nickel) in batteries.
In addition the projected supply deficits for copper and nickel (more severe than previous cycles) would suggest further price appreciation is likely after this current pullback.
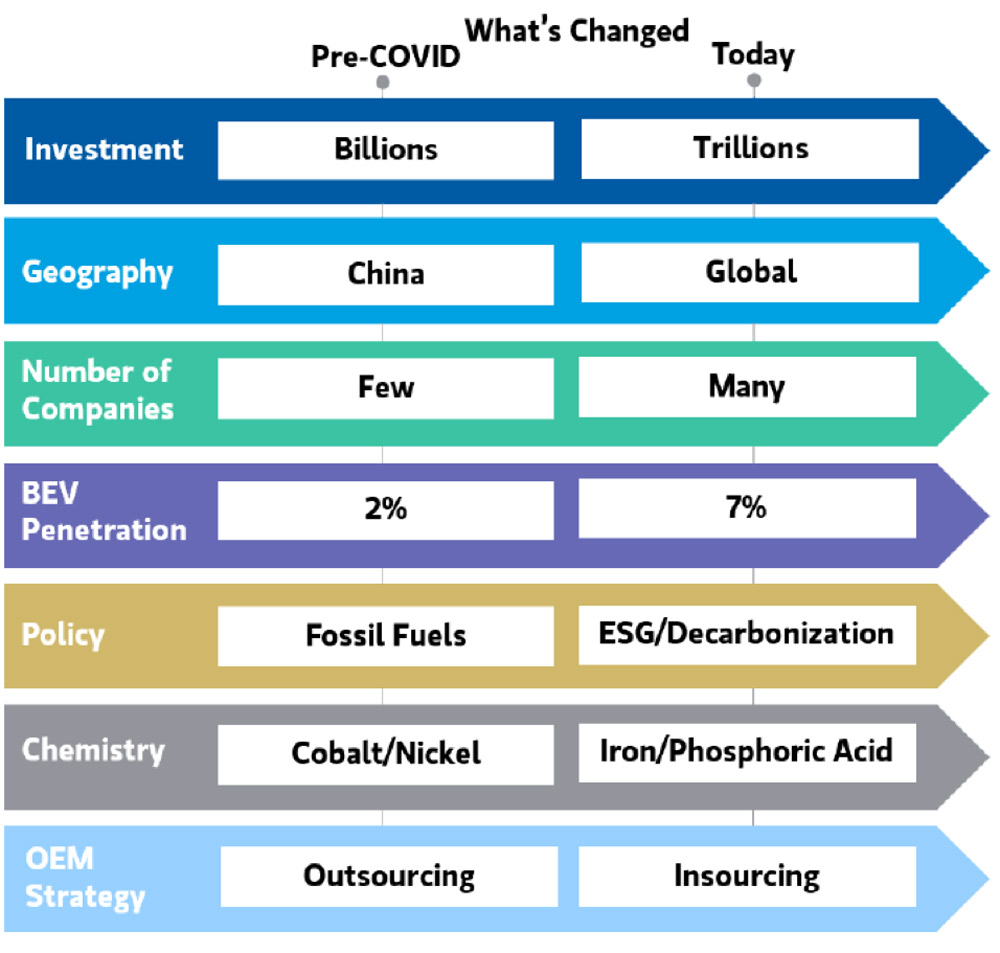
And what else has changed? Quite a bit according to Morgan Stanley (figure 6).
FIGURE 6: Pre-COVID 19 to today, whats changed? (source; Morgan Stanley Wealth Management, May 2022).
The Stockhead faithful can rest assured that the cyclical moves in base and precious metal markets have became very clear to me as I looked out over the snow-covered peaks of Val D’Isere last week on one of my fact-finding missions.
While I was at 11,400 feet and a little low on oxygen (not helped by another Nicuaraguan cigar), a pot of gold emerged at the end of the horizon just beyond a pile of economic rubble from a recent avalanche.
As liquidity dries up in the junior end, any portfolio re-positioning should look to ‘buy the sector’ if you are contemplating a rotation back into the gold sector.
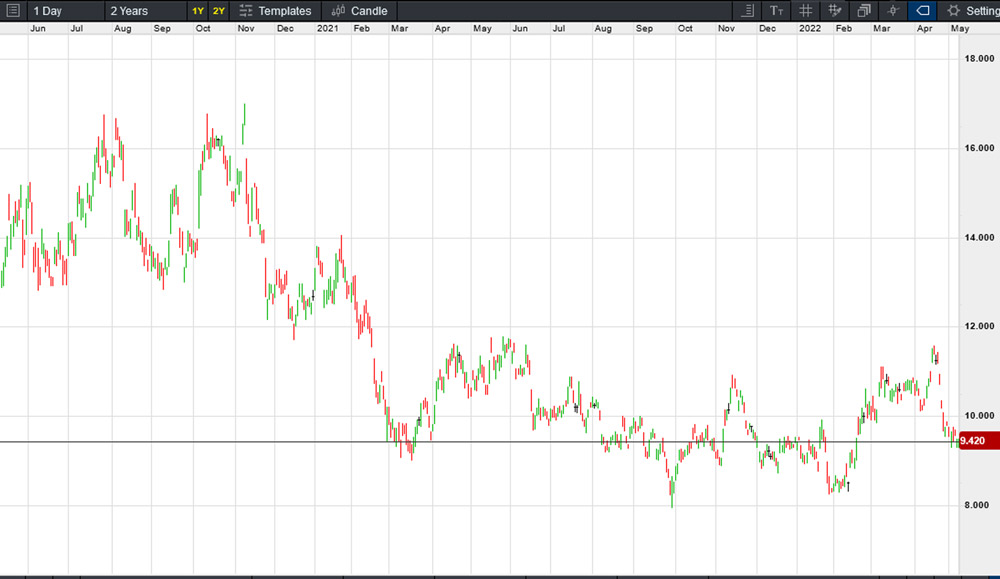
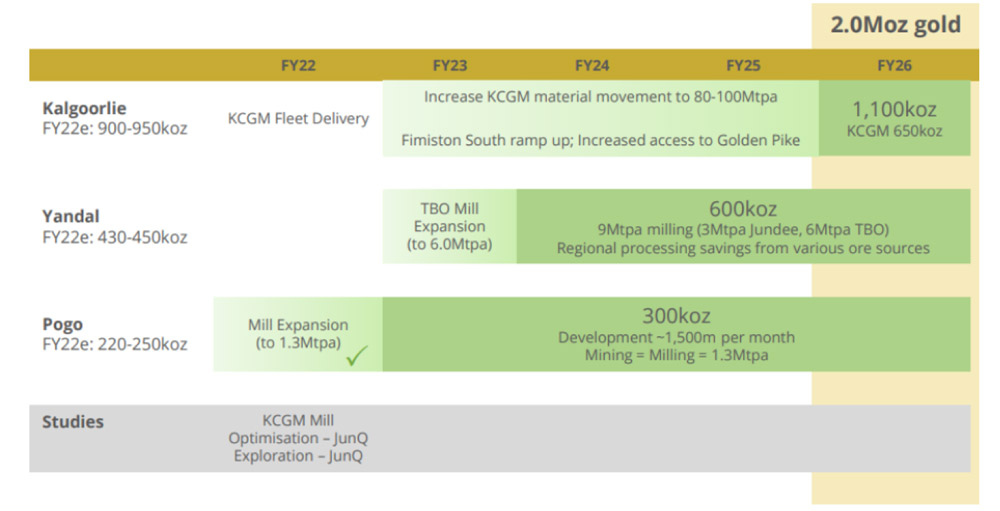
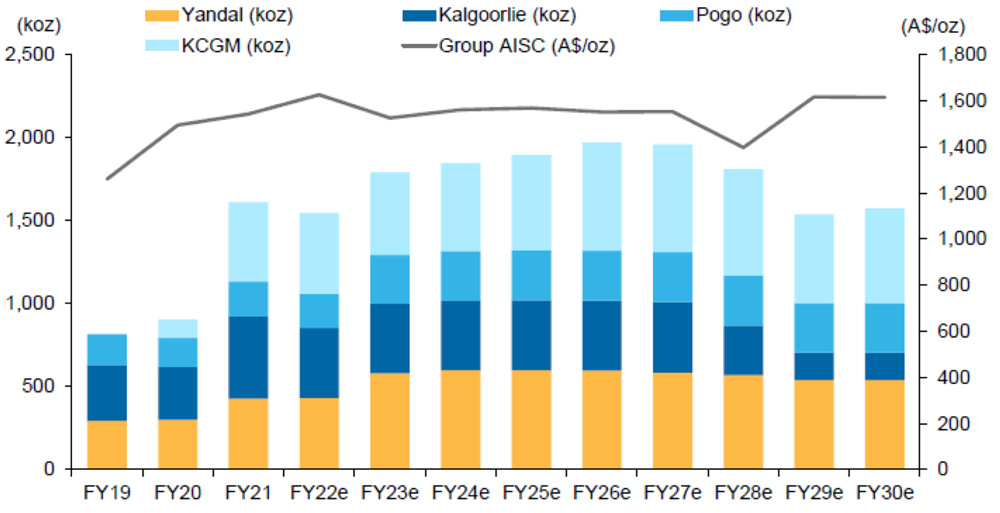
All of these companies have struggled with rising costs and lower production (compared to guidance) with possibly NST (figure 7) having the largest near term upside, underpinned by a stronger balance sheet (net cash of over $400 million) and pathway to 2Moz (Figure 8, 9) of gold production per annum.
FIGURE 8: NST production roll out (source; Northern Star Mining, May 2022).FIGURE 9: NST production projections to FY 2030 (source; Macquarie Research, 5 May 2022).
Macquarie have calculated a sum-of parts valuation of around $18.93/share based on spot prices and $14.00/share based on 50% 1.3 x Net Asset Value and 50% based on 10x cash flow per share.
When the sector rotation back into gold equities takes place later in CY 2022, NST is sure to be a beneficiary.
At RM Corporate Finance, Guy Le Page is involved in a range of corporate initiatives from mergers and acquisitions, initial public offerings to valuations, consulting, and corporate advisory roles.
He was head of research at Morgan Stockbroking Limited (Perth) prior to joining Tolhurst Noall as a Corporate Advisor in July 1998. Prior to entering the stockbroking industry, he spent 10 years as an exploration and mining geologist in Australia, Canada, and the United States. The views, information, or opinions expressed in the interview in this article are solely those of the interviewee and do not represent the views of Stockhead.
Stockhead has not provided, endorsed, or otherwise assumed responsibility for any financial product advice contained in this article.
share
Link copied to clipboard
SUBSCRIBE
Get the latest Stockhead news delivered free to your inbox.
It's free. Unsubscribe whenever you want.
By proceeding, you confirm you understand that we handle personal information in accordance with our Privacy Policy.
Get the latest Stockhead news delivered free to your inbox
For investors, getting access to the right information is critical.
Stockhead’s daily newsletters make things simple: Markets coverage, company profiles and industry insights from Australia’s best business journalists – all collated and delivered straight to your inbox every day.
Markets coverage, company profiles and industry insights from Australia’s best business journalists – all collated and delivered straight to your inbox every day.
It’s free. Unsubscribe anytime.
By proceeding, you confirm you understand that we handle personal information in accordance with our Privacy Policy.
I want the news:
Hear it first
Get the latest Stockhead news delivered free to your inbox.
Thanks! You’re subscribed, Stockhead news is coming your way soon.