
Pic: Getty
Free Whelan: Out of traction and back in action; where to look as things turn bullish
Experts
Pic: Getty
Experts
In this Stockhead series, investment manager James Whelan from VFS Group offers his insights on the key investment themes and trends in domestic and global markets. From macro musings to the metaverse and everything in between, Whelan offers his distilled thoughts on the hot topic of the day, week, month or year, from the point of view of a professional money manager.
Speaking freely, I can say with all confidence that the market is out of traction and back in action.
The Fed have raised for the first time in years and the old “there’s no surprises left” saying is kicking right into gear.
Hopefully you didn’t miss out last week. And hopefully, you were paying attention to Free Whelan on March 1, when Russia-Ukraine was escalating and markets had the jitters.
(A couple of reminders from that edition: 1. Panic makes great headlines, and 2. Sell-offs on fear of nuclear war are a buying opportunity.)
But first, the latest stats – and the caveat that you cannot guarantee anything going forward based on past performances.
But last week was rare. As in, four consecutive +1% gains type-of-rare.
On average, if the S&P 500 has four days like that it tends to add another 28% over the following 12 months.
You know what? That’s good enough for me.
Staying with the historical stats, if the S&P500 has three days +1% in a row then from there on out, it goes on to post an average annual gain of 24.8%.
Such a trend has occurred 11 such times in the last 20 years.
Ready for more stats on last week’s rebound?
Marketcharts.com also did some work, and if the Nasdaq has +80% of its stocks below their 10-day moving average, before snapping back to where +90% of stocks trade above that 10-day level, then the Nasdaq goes on to post an average gain of 34.8% for the next 12 months.
It’s happened 15 times since 1996.
So we have lots of bullish indicators, and I’m happy to commit to the market as a whole.
That said, we’re not ready to rip the top off and pile back into high-growth tech.
I can’t stress enough how important it is to make sure you have some Value in your portfolio.
VVLU is the Vanguard ETF we like the most for this.
Flows are still strong into ETFs globally, with the gross inflows up to the middle of last week only falling just short of the all-time record set in 2021.
Vanguard accounts for about half of those flows. At a glance, it’s just index and value ETFs picking up the flow. In other words, the market looks happy to have a healthy amount of capital allocated to it.
This is VTV which is the US-listed Vanguard Value ETF, and I can’t imagine a more bullish chart.
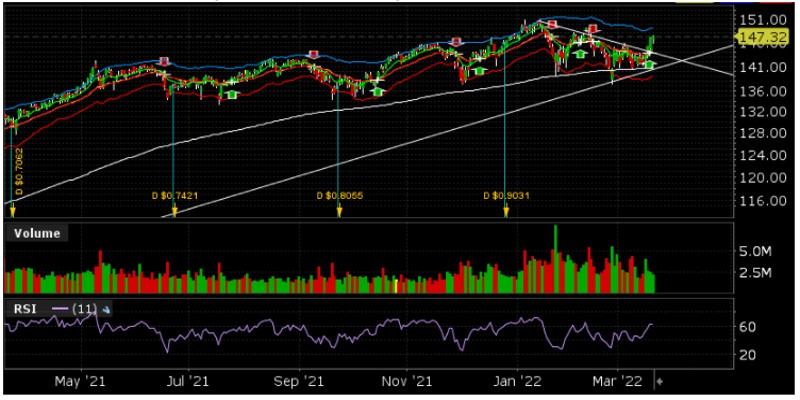
All I’m saying is that there is flow going into the market, so pay attention.
Meanwhile, China wrong-footed me massively.
Chinese government support for stocks, and a commitment that they were ending their regulatory nonsense, squeezed shorts hard.
Some things that I exited in China shot up ~40% in a night, meaning they only needed another 30% to get back to where I sold.
For those thinking it’s all rosy and they can charge back in, I’ll remind you that the procedures are now set for what the world will do if a country breaks bad.
You get booted from SWIFT, can’t sell your resources, can’t sell your gold reserves, have your FX RESERVES FROZEN (!!) and have a ban on every fund holding your stock.
If China is seen to be colluding or assisting beyond anything deemed appropriate, then the first thing to go will be the stock holdings.
But if you’re keen on the area then KWEB, ASIA or CNYA are the preferred ETFs.
Finally, I’ll leave you with the following Twitter. This is it, the end-game. We really have gone full-crazy.
The activist investor that forced a board shakeup at Exxon Mobil to accelerate a move to clean energy is calling on U.S. shale to produce more https://t.co/zZrqxZG3F0
— Bloomberg Energy (@BloombergNRG) March 18, 2022
Stay safe and all the best,
JW.
The views, information, or opinions expressed in the interview in this article are solely those of the writer and do not represent the views of Stockhead.
Stockhead has not provided, endorsed or otherwise assumed responsibility for any financial product advice contained in this article.


Get the latest Stockhead news delivered free to your inbox.


