
Investors are going crazy for IPOs and capital raisings this year, says expert
IPO Watch
IPO Watch
ASX-listed companies raised 46 per cent more in the first five months of the year than they did in the same time in 2017.
“Resources issues accounted for 55 per cent of new issues from companies with market cap of less than $50 million — by far and away the biggest sector of the micro cap end — driven by commodity prices and some spectacular investment wins in the sector,” said Bridge Street Capital Partners executive director Alex Sundich.
“Perth brokers have been quite active and good stories continue to sell. We have also seen renewed interest in the oil and gas sector as global oil prices rallied over May.”
Small caps made up just a fraction of the $7.9 billion total, raising less than $200 million from investors, according to data from Bridge Street Capital Partners.
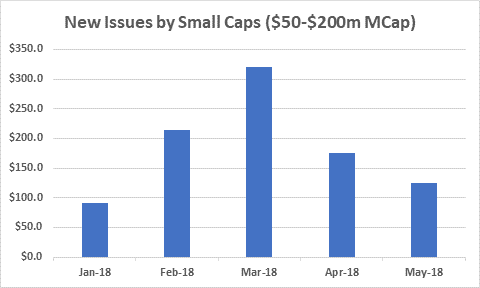
In the small cap sector — $50 million to $200 million market cap — resources, tech and industrials all issued new stock with March being the boom time.
Mr Sundich says reduced market activity leading into June is because it’s the tax-loss selling season and due to some notable upsets.
“There has been a noticeable reduction in liquidity at the smaller end of the market.
“The Jupiter Mines IPO has so far disappointed investors which has weighed on sentiment in the resources space.
“In addition, the recent failure of the Prospa’s IPO, while technically not for reasons of insufficient demand, has certainly rattled the confidence of domestic small cap institutions.”
But if markets stabilise and there aren’t any surprises, Mr Sundich believes the rest of 2018 should be a busy year in the markets as a “reasonablee pipeline” of deals is coming through.
“However, the performance of the upcoming $70 million raising for Marley Spoon will be a real litmus test of investor sentiment towards IPOs going forward, as the business is being marketed on its strong growth prospects rather than business fundamentals such as earnings, cash flow and dividends, none of which it has.
“Marley Spoon is certainly being described in some circles as a classic “top of the market” IPO so it will be interesting to see how it goes.
Below is a list of all of the equity capital market deals completed in the five months to May 31, collated by Bridge Street Capital Partners. Each deal is counted from the date the new shares trade, and the data only includes primary sales.
| Market Cap | Total Raised ($m) | % of Total | Total Deals | Avg. Deal Size ($m) |
|---|---|---|---|---|
| < $50m | $672.6m | 0.085 | 192 | $3.5m |
| $50m - $200m | $925.3m | 0.116 | 70 | $13.2m |
| $200m - $1,000m | $1.3b | 0.161 | 20 | $64.1m |
| >$1,000m | $5.1b | 0.638 | 15 | $338.6m |
| Total | $8b | 1 | 297 | $26.8m |
| Market Caps <$50m: | ||||
| IPO | $211.3m | 0.314 | 26 | $8.1m |
| Rights Issue | $106.1m | 0.158 | 24 | $4.4m |
| Placement | $342.4m | 0.509 | 139 | $2.5m |
| Other | $12.8m | 0.019 | 3 | $4.3m |
| Total | $672.6m | 1 | 192 | $3.5m |
| Communications | $27.8m | 0.041 | 15 | $1.9m |
| Consumer | $110.6m | 0.164 | 21 | $5.3m |
| Resources | $371.9m | 0.553 | 117 | $3.2m |
| Financial | $23.1m | 0.034 | 6 | $3.9m |
| Industrial | $35m | 0.052 | 8 | $4.4m |
| Technology | $104.3m | 0.155 | 25 | $4.2m |
| Total | $672.6m | 0.794 | 192 | $3.5m |
| Market Caps $50m - $200m: | ||||
| IPO | $136.4m | 0.147 | 5 | 27.3m |
| Rights Issue | $306.5m | 0.331 | 17 | 18m |
| Placement | $477.5m | 0.516 | 47 | 10.2m |
| Other | $5m | 0.005 | 1 | 5m |
| Total | 925.3m | 1 | 70 | 13.2m |
| Agriculture | $2m | 0.024 | 1 | $22m |
| Communications | 11.2m | 0.012 | 1 | $11.2m |
| Consumer | 198.2m | 0.214 | 15 | $13.2m |
| Resources | $49.4m | 0.378 | 35 | $10m |
| Financial | $185.8m | 0.201 | 6 | $31m |
| Industrial | $93.4m | 0.101 | 9 | $10.4m |
| Technology | $65.4m | 0.071 | 4 | $16.3m |
| Total | $925.3m | 1 | 71 | $13m |


Get the latest Stockhead news delivered free to your inbox.