'Ah wheel say zis unly wernce.' Picture: Getty Images
Three Ts: Crypto’s killer app, zoom out for the ups, and Quant joins the Resistance
Coinhead
'Ah wheel say zis unly wernce.' Picture: Getty Images
Coinhead
Welcome to the Three Ts with CoinJar. Each fortnight we explore a big Theme, an interesting Trade and some good, old-fashioned Technical Analysis (courtesy of Carl Capolingua of Thinkmarkets Australia).
During the bull run of 2017, one of crypto’s most piercing catchcries became its promise to “bank the unbanked”. In countries with poor financial infrastructure and untrustworthy banks, the story went, blockchain could sweep in and deliver secure and accessible forms of money.
This obviously didn’t happen and in the intervening years, banking the unbanked slipped down crypto’s priority list – everyone got too busy flipping jpegs tbh – but now there are signs that the unbanked (as well as the poorly banked and those with an unreliable central bank) could well become a primary driver of crypto adoption.
The average cost of sending money internationally is 6%, according to the world bank, or $16B a year in fees.
Stablecoins are effectively free.
This is crypto's most simple and straightforward use case at the moment.
Source: https://t.co/Gw4eNlLApp. pic.twitter.com/LDRyKPUSRe
— Dunleavy (@dunleavy89) October 3, 2022
Here are some stats: according to research by Mastercard, 51% of adults in Latin America have already used cryptocurrency to make a purchase, of which two-thirds were in stablecoins. 40% of Brazilians own some crypto. In Nigeria it’s 32%. Developing nations dominate the top 20 in Chainalysis’ Crypto Adoption Index.
While it would be a mistake to think all these countries come to crypto in exactly the same way, the true throughline is US dollar denominated stablecoins. Having simple, secure and cheap access to US dollars is a revolutionary innovation in countries with soaring inflation, limited access to banking, capital controls and unreliable local currencies.
Latin America’s crypto adoption is being led by retail users, according to a Paxos study that highlighted the role stablecoins are playing.@luo_trista reports: https://t.co/cOABYc23T0
— CoinDesk (@CoinDesk) September 13, 2022
The irony here is strong. Bitcoin was founded as a direct challenge to the economic hegemony of the US dollar. Yet the technologies it has spawned could help entrench its fundamental necessity.
Crypto isn’t going to displace long-standing systems of remittance and finance overnight. But when our focus is typically on the ups and downs of price and the hot new consumer use case, it’s worth remembering that for billions of people the calculus around crypto might be entirely different.
The only narrative #bitcoin maxi’s have is that the price went up the last decade
Stablecoins have much more utility than #bitcoin, i’m becoming more bearish on bitcoin by the day and believe eth will overtake it
— Algod🫐 (@AlgodTrading) October 2, 2022
These are the worst parts of the bear market: the long days and weeks and months of nothing. Literally nothing of consequence has happened in the crypto markets since Bitcoin crashed to US$17k in mid-June. You can point to all the indicators that you want, but until something actually pops off (which you can read as a definitive break of US$17k or US$25k) you may as well be putting your money on black or red down at the casino.
So, when the short-term picture is as thrilling as being socked in the face with wet newspaper, it’s a good opportunity to zoom out a bit and see what’s really at stake.
Crypto analyst Scott Melker is a big fan of this logarithmic monthly chart, which shows the Bitcoin price has inhabited a single upwardly inclined channel since 2013. You can see that the price has been dicing with destiny over the last few months but now it’s really getting to the pointy end of things.
Every other time the price has flirted with the lower edge of the channel it has precipitated an almighty rally. Is this time different? And if it does bounce will it be now, or after faking out a drop below the crucial support?
New monthly candle starting with rising support. pic.twitter.com/gNJKBLNgBH
— The Wolf Of All Streets (@scottmelker) October 1, 2022
Bitcoin vs $US (BTCUSD)
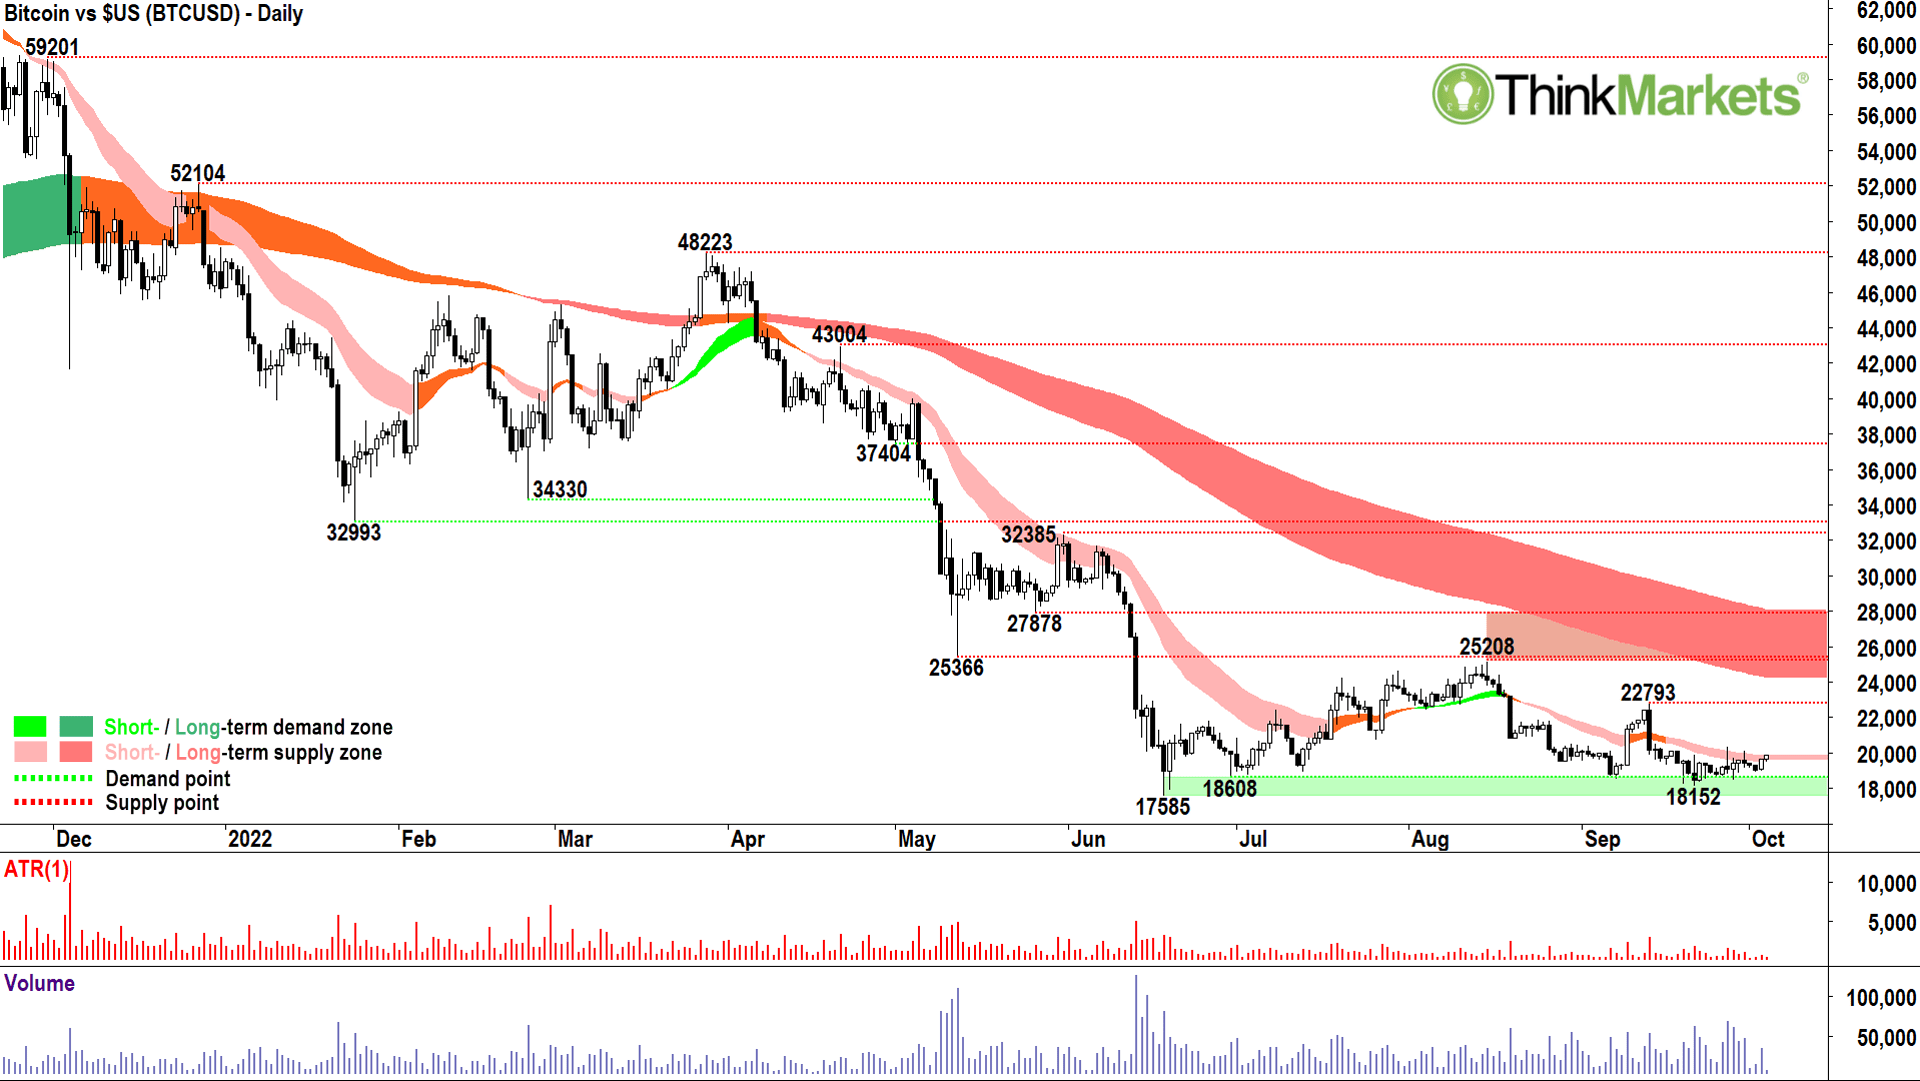
Hey, at least it didn’t melt down with the recent wave of risk-off! Still, it would be nice should we see the words “risk-on” return to global investors’ vocabulary, we get some sort of a bounce here. And looking at the chart, I’d take any bounce I can get! At least to test 22793 which is the closest major supply point, and in a dream, the all-important 25366 level which caps the top of this super-well-entrenched trading range.
The candles and price action have really flattened out, but let me just call them “not terrible” for now. Dare I say, 22793 is beginning to firm as a more likely scenario than the bear case, i.e., a test of 18152. Just checking that bear case, below 18152 looms the “the big test”, that is, the major swing low of 17585. Below this point, the 26 Jun 2019 bull market high of 13870 beckons.
Ethereum vs $US (ETHUSD)

Like Bitcoin, Ethereum is flattening in a tight range with few candles or price action signals to inform of a break either way. Typically though, in situations like these, the technical analyst defers to the price action prior to the trading range – which was down. A break below 1218 would almost certainly see the 1000 handle tested.
I expect there to be some demand there to hold prices up at least in the short term, but in the longer term, it this handle slips, only 880 stands between Ethereum and oblivion.
Quant vs $US (QNTUSD)
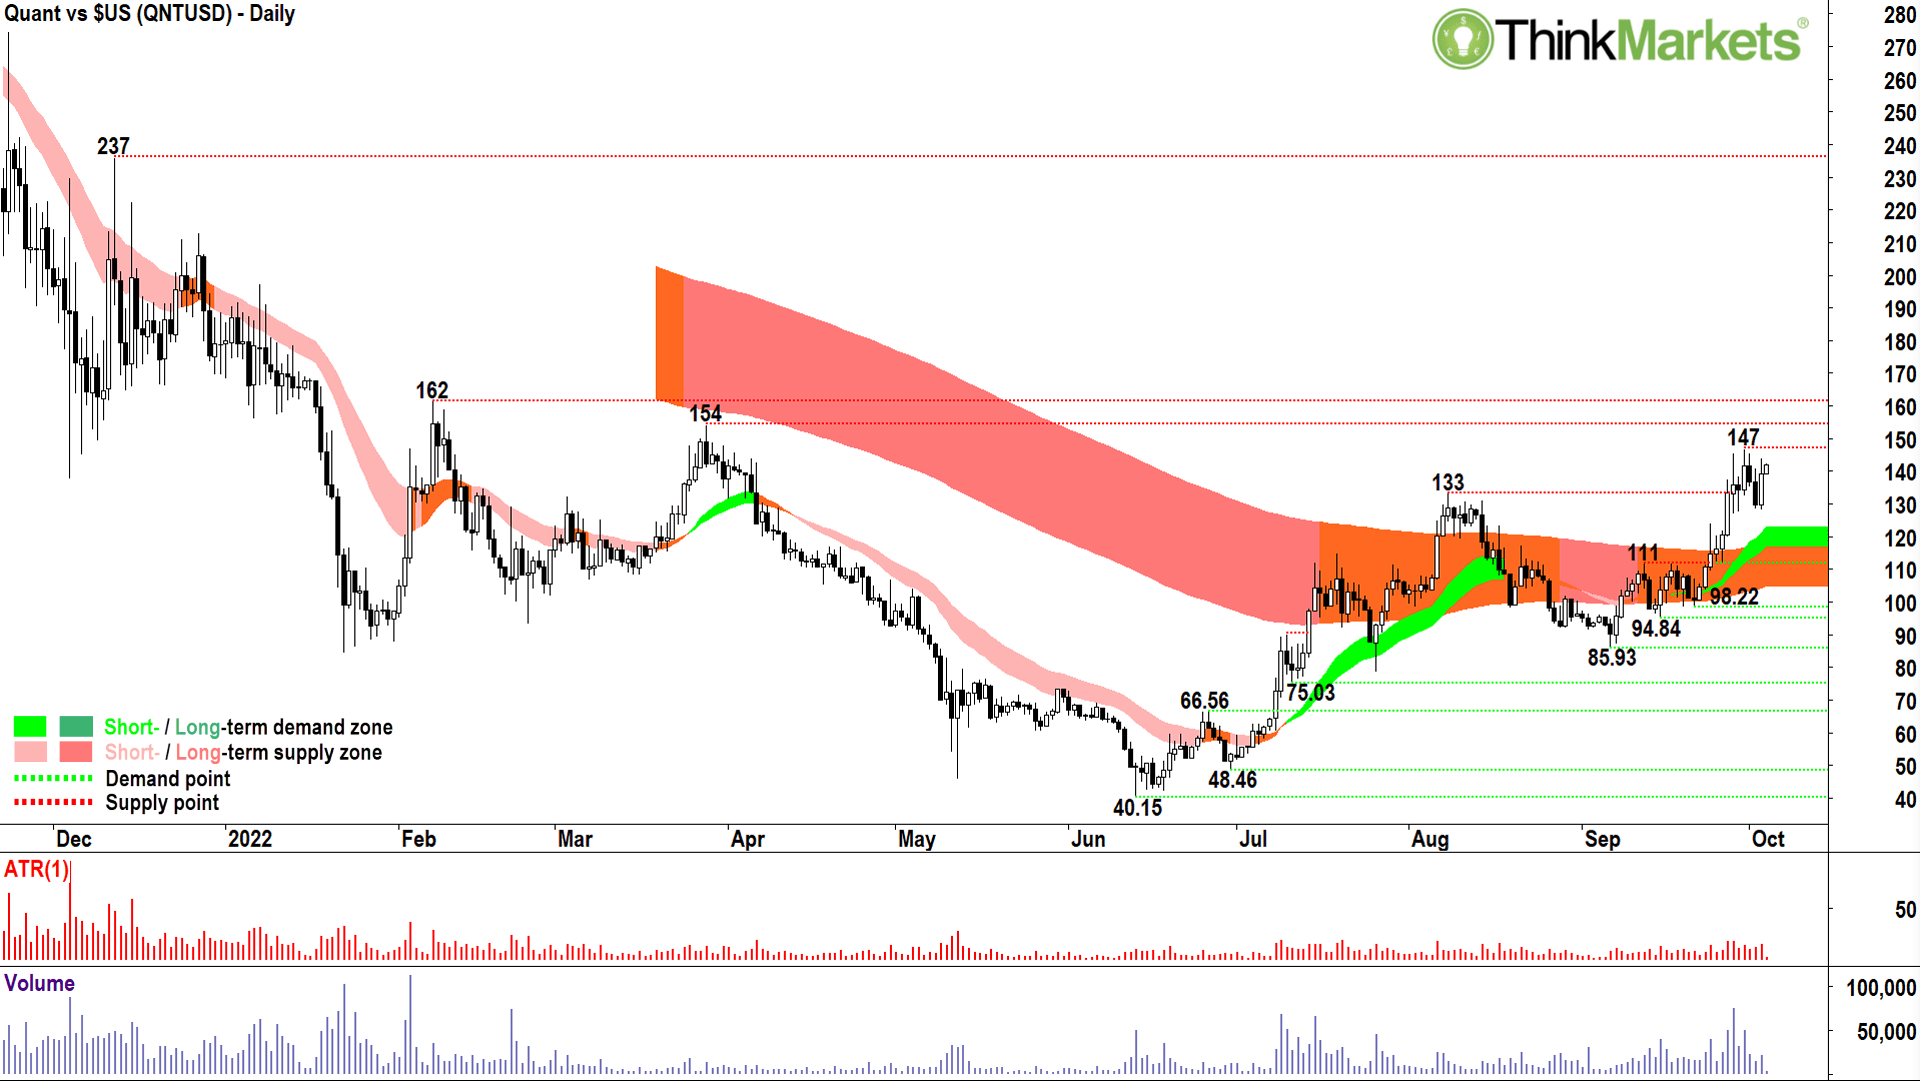
There are only two charts in the Top 100 Cryptos by market capitalisation which aren’t in well-established long-term downtrends. Chiliz is one I’ve discussed earlier…and this is the other as of last week.
The Quant chart provides an instructional snapshot of what “everything else” must do prior to even being considered as a buy by trend followers and momentum traders. It must shrug off its long-term downtrend averages by moving above them, then retesting them, and finally by pushing higher off them thus using them as a “trampoline”.
This is exactly what the Quant chart has done, and even better, it’s done it with a cluster of excellent demand-side candles. Yes, there’s some pesky resistance in the offing, and I mean the 154-162 zone here… But the shallow pullback so far from 147 gives some encouragement that only minimal supply exists in that region.
Hey, I’ve seen better charts, sure – but are none better than this in the crypto universe right now! 😁
(Attractive tokenomics here… full supply of 12 million tokens out… i.e., no inflation and limited supply. Focussed on interoperability and Dapps. No 33 on Market Cap list.)
CoinJar is Australia’s longest-running crypto exchange. Since 2013, CoinJar has helped more than half-a-million Australians buy and sell billions of dollars in cryptocurrency.
FX Evolution is Australia’s premier forex, stock and crypto trading community.
The views, information, or opinions expressed in the interviews in this article are solely those of the interviewees and do not represent the views of Stockhead. Stockhead does not provide, endorse or otherwise assume responsibility for any financial product advice contained in this article.


Get the latest Stockhead news delivered free to your inbox.